Anatomy & Physiology · Children's & Adult Nursing
ECG & Cardiac Conduction
Where the heartbeat actually starts, how to read a waveform, a structured way to approach any rhythm strip, and the common arrhythmias compared side by side — for both branches.
Save for later
Student note
Depolarisation is the electrical trigger for contraction; repolarisation is the cell resetting afterwards. SVT stands for supraventricular tachycardia. VT and VF are ventricular tachycardia and ventricular fibrillation. PEA is pulseless electrical activity — an organised rhythm with no effective circulation.
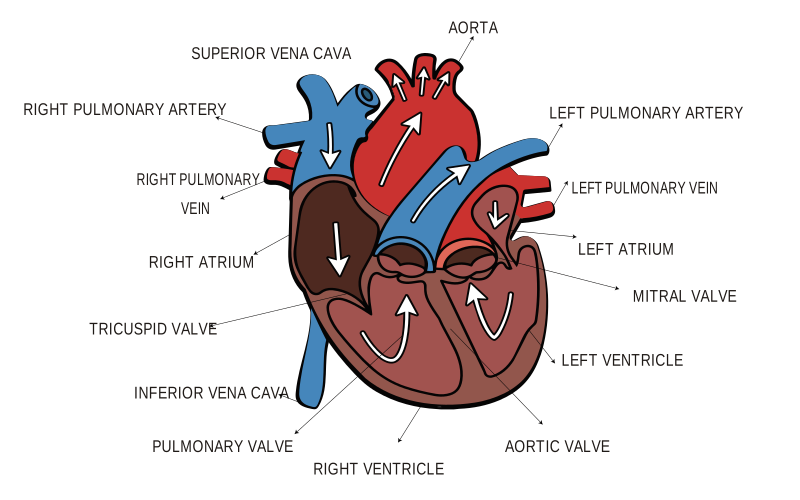
Tap any dot to see what that part does, or press “Follow the blood” to watch one full loop draw itself.
Tap the dots to explore the heart, or follow one full loop of blood — worth holding in mind as you read the conduction pathway below

The route
SA node → AV node → Bundle of His → bundle branches → Purkinje fibres.
P-QRS-T
P = atria triggered. QRS = ventricles triggered. T = ventricles resetting.
5-step approach
Rate → regularity → P before QRS? → narrow/wide QRS? → is the patient perfusing?
Trace vs patient
The monitor shows the rhythm; the pulse shows whether it is actually effective.
The Conduction Pathway
Where does the electrical signal actually start, and where does it go?
The route
- SA node (right atrium) – the natural pacemaker
- → spreads across both atria → AV node
- AV node: brief delay, lets the ventricles finish filling
- → Bundle of His → left/right bundle branches → Purkinje fibres
Why the AV delay matters
- Without it, atria and ventricles would contract almost together
- The pause lets blood finish moving from atria into ventricles
- This protects effective stroke volume
Backup pacemakers
- SA node: intrinsic rate ~60–100 bpm – normally wins
- AV node/junctional tissue: ~40–60 bpm if SA node fails
- Purkinje/ventricular tissue: ~20–40 bpm as a last resort
Why this hierarchy matters
- If a higher pacemaker fails, a lower one can take over – just slower
- This is why some bradycardias are still "junctional" rhythms, not asystole
- Rate alone hints at which part of the system is actually driving the heart
Clinical pearl
The conduction system has built-in backups. If the SA node fails, the AV node can take over at a slower rate; if that fails too, ventricular tissue can still fire on its own. This is why a slow rhythm is not automatically "no rhythm" – it may be a lower pacemaker doing its job.
Reading the Waveform
What does each part of the trace actually represent underneath?
P wave
- Atrial depolarisation (the atria being triggered to contract)
- Normal: small, rounded, upright in most leads
- One P wave should precede each QRS in normal sinus rhythm
PR interval
- Start of P wave to start of QRS
- Represents the signal travelling through the AV node delay
- Normal: roughly 120–200 ms (3–5 small squares)
QRS complex
- Ventricular depolarisation – the big contraction signal
- Normal: narrow, under ~120 ms (3 small squares)
- A wide QRS suggests an abnormal conduction pathway through the ventricles
ST segment, T wave & QT
- ST segment: brief pause before the ventricles reset
- T wave: ventricular repolarisation – the ventricles resetting electrically
- QT interval: total time for ventricular depolarisation + repolarisation
Clinical pearl
A simple way to remember it: P = atria triggered, QRS = ventricles triggered (the big squeeze), T = ventricles resetting. Once that sequence is automatic, most rhythm strips become a pattern-matching exercise rather than a memory test.
Rate & Rhythm: A Structured Approach
Faced with any strip, what is the actual order of questions to ask?
Step 1 & 2
- 1. Rate – too fast, too slow, or normal for age?
- 2. Regularity – regular, or irregularly irregular?
- Do this before trying to name the rhythm
Step 3 & 4
- 3. Is there a P wave before every QRS?
- 4. Is the QRS narrow or wide?
- These four answers narrow down most common rhythms
Step 5: the patient
- 5. Is the child/patient perfusing? Pulse, colour, CRT, consciousness
- The monitor shows the rhythm; the pulse shows whether it is effective
- Pulseless electrical activity (PEA): organised rhythm, no output
Quick rate calculation
- 300 ÷ number of large squares between R waves (regular rhythm)
- Or: count QRS complexes in a 6-second strip × 10
- Useful as a fast estimate before a precise count
Clinical pearl
The ECG tells you the rhythm; the patient tells you whether that rhythm is producing effective circulation. Always link the trace back to pulse, colour, and consciousness – a "normal-looking" rhythm with no pulse is a resuscitation emergency, not a reassuring strip.
Common Arrhythmias Compared
How do the everyday abnormal rhythms actually differ from each other?
Sinus tachycardia / bradycardia
- Normal P-QRS relationship, just faster or slower than expected
- Often a response to fever, pain, hypovolaemia, fitness, or medication
- Usually not the primary problem – look for the underlying cause
Atrial fibrillation
- Irregularly irregular rhythm
- No clear, consistent P waves – chaotic atrial activity instead
- Common in adults; increases stroke risk due to atrial stasis
SVT
- Fast, narrow-complex rhythm, often >200 bpm in children
- P waves often absent or hard to see
- Classically starts and stops suddenly, unlike a gradual rate rise
VT / VF & heart block
- VT: wide-complex, fast, can be life-threatening
- VF: chaotic, no organised complexes – no cardiac output at all
- Heart block: PR prolongation (1st), dropped beats (2nd), or full AV dissociation (3rd)
Red flags
Clinical pearl
Narrow vs wide QRS is one of the fastest ways to triage an unfamiliar fast rhythm. Narrow complexes usually mean the signal is still travelling through the normal conduction pathway; wide complexes suggest it is not – and wide-complex tachycardias are treated with much more caution.
Paediatric vs Adult ECG
Why can a "normal" child’s ECG look alarming if you are only used to reading adult traces?
Heart rate ranges
- Newborn: roughly 100–160 bpm at rest
- Rates fall gradually through childhood towards adult range
- A rate that is normal for an infant would be tachycardia in an adult
Axis & precordial pattern
- Right axis deviation can be normal in neonates
- Reflects a dominant right ventricle at birth
- T wave inversion in right-sided chest leads can be a normal juvenile pattern
Why this matters
- A finding that would be abnormal in an adult can be normal in a child
- Always interpret against age-specific reference ranges
- When unsure, compare with the child’s own baseline trace if available
What stays the same
- The conduction pathway itself: SA → AV → His → Purkinje
- The basic waveform meaning: P, QRS, T represent the same events
- The principle of linking rhythm to perfusion, at any age
Clinical pearl
Do not apply adult ECG reference ranges to a child’s trace by habit. Faster resting rates, right axis deviation, and juvenile T wave patterns can all be completely normal in children – the same finding in an adult might prompt real concern.
Nursing Priorities & Escalation
Once you have read the strip, what do you actually do with that information?
Always do this first
- Check the patient, not just the screen – pulse, colour, consciousness
- Confirm lead placement/contact before assuming a true arrhythmia
- Compare with the patient’s baseline rhythm if one is known
Escalate without delay
- Any new arrhythmia with symptoms (dizziness, chest pain, collapse)
- Wide-complex tachycardia
- Bradycardia with hypotension or reduced consciousness
- Any rhythm on the monitor without a corresponding pulse
Monitoring considerations
- Continuous monitoring shows trend; a 12-lead gives more diagnostic detail
- Document rate, rhythm, and how the patient tolerated it, not just "abnormal ECG"
- Artefact (movement, lead fall-off) can mimic arrhythmia – always correlate clinically
Communicating findings
- "The monitor shows the rhythm; the patient tells us whether it is being tolerated."
- Describe rate, regularity, P-QRS relationship, and QRS width when handing over
- State clearly whether this is new or a known baseline for that patient
Clinical pearl
An ECG finding only matters in context. The same rhythm can be a stable baseline for one patient and a genuine emergency for another – always read the strip alongside the patient in front of you, not in isolation.
The conduction system, step by step — each label shows what happens and where it appears on the ECG

Try it: Explore One Heartbeat
In the heart: The signal races down the bundle branches and Purkinje fibres and the ventricles contract: the big squeeze. Q is the first small dip, R the tall spike, S the dip after it. The atria reset at the same time, hidden behind this.
What to look for: Should be narrow (under 0.12 s, three small squares). A wide QRS means the signal is taking a slower route, as in bundle branch block or a rhythm starting in the ventricles.
Drag the handle along the trace, or tap a wave, segment or interval
Reading the trace
Conduction Pathway Reference
| Structure | Location | Role |
|---|---|---|
| SA node | Right atrium, near the SVC | Natural pacemaker; sets the normal heart rate (~60–100 bpm). |
| AV node | Between atria and ventricles | Delays the signal briefly, letting ventricles finish filling before contracting. |
| Bundle of His | Interventricular septum | Carries the signal from the AV node towards the ventricles. |
| Bundle branches | Left and right, either side of the septum | Spread the signal down through each ventricle. |
| Purkinje fibres | Throughout the ventricular walls | Rapidly distribute the signal so both ventricles contract together. |
Waveform Reference
| Part | Represents | Normal duration/appearance |
|---|---|---|
| P wave | Atrial depolarisation | Small, rounded; part of a ~0.8s cycle at normal rate |
| PR interval | AV node delay before ventricular signal | ~120–200 ms (3–5 small squares) |
| QRS complex | Ventricular depolarisation | <120 ms (up to 3 small squares) |
| ST segment | Brief pause before ventricles reset | Usually isoelectric (flat) |
| T wave | Ventricular repolarisation | Rounded, usually upright in most leads |
| QT interval | Total ventricular depolarisation + repolarisation time | Varies with heart rate; corrected as QTc |
A Real Sinus Rhythm, Labelled
| Check | What this trace shows | Normal |
|---|---|---|
| Rate | About 66 beats a minute on average. Between two of these beats the R–R interval is about 4 large boxes, and 300 ÷ 4 is roughly 75 | 60–100 in an adult |
| Rhythm | Regular overall. The gaps between beats shorten and lengthen slightly with breathing, which is called sinus arrhythmia | Normal and common in young people |
| P waves | A P wave before every QRS, all the same shape and upright in lead I | One P for every QRS means the SA node is in charge |
| PR interval | About 4 small boxes, roughly 0.16 to 0.18 s | 0.12–0.20 s (3 to 5 small boxes) |
| QRS | Narrow and sharp, under 3 small boxes | Under 0.12 s |
| ST segment and T wave | ST segment sits on the baseline and the T wave is upright and rounded | No ST shift, T upright in lead I |
Clinical pearl
This is one lead, recorded from a smartwatch, so it is a good picture of rate and rhythm but it cannot show which wall of the heart is affected or rule out a heart attack. That needs the 12-lead below. “Sinus” means the beat starts in the SA node, and the proof is a P wave in front of every QRS.
Where the Stickers Go: 3-Lead vs 12-Lead
The big idea
A lead is not a sticker. A lead is a view of the heart's electricity from one angle. The 12-lead ECG uses just 10 stickers to make 12 views: the 4 limb stickers create 6 limb leads (I, II, III, aVR, aVL, aVF) and the 6 chest stickers create 6 chest leads (V1–V6). The right leg sticker is only an earth, so it gives no view of its own.
| 3-lead | 5-lead | 12-lead | |
|---|---|---|---|
| Electrodes (stickers) | 3 | 5 | 10 |
| Views of the heart | One at a time: lead I, II or III | The 6 limb leads plus 1 chest lead | 12: 6 limb leads and 6 chest leads |
| Recording | Continuous | Continuous | A snapshot, usually about 10 seconds |
| Best for | Watching rate and rhythm, and quick checks | Monitoring on wards and HDU, including some ST changes | Diagnosing: where the problem is, ischaemia, conduction blocks |
| Cannot tell you | Which part of the heart is affected, or most ischaemia and blocks | The full picture of every wall of the heart | How the rhythm changes over time. It is one moment |
3-lead: rhythm monitoring
| Electrode | Where it goes |
|---|---|
| Red (RA) | Right shoulder, just below the collarbone |
| Yellow (LA) | Left shoulder, just below the collarbone |
| Green (LL) | Left lower chest or abdomen |
Why it works
Each side of the triangle is one lead, made from two electrodes: lead I from right arm to left arm, lead II from right arm to left leg, lead III from left arm to left leg. Lead II runs roughly along the direction the heartbeat travels, so the P waves and QRS look clearest, which is why it is the usual choice for watching rhythm.
12-lead: the full picture
| Limb electrode | Where it goes | Job |
|---|---|---|
| Red (RA) | Right wrist | Right arm |
| Yellow (LA) | Left wrist | Left arm |
| Green (LL) | Left ankle | Left leg |
| Black (RL) | Right ankle | Earth only. It gives no view of its own |
| Chest lead | Usual colour | Where it goes |
|---|---|---|
| V1 | Red | 4th intercostal space, right of the sternum |
| V2 | Yellow | 4th intercostal space, left of the sternum |
| V3 | Green | Halfway between V2 and V4 |
| V4 | Brown | 5th intercostal space, mid-clavicular line |
| V5 | Black | Same level as V4, anterior axillary line |
| V6 | Violet | Same level as V4, mid-axillary line |
Two planes, twelve views
The limb leads look at the heart from the sides, like standing in front of the body, so they see the frontal plane. The chest leads look from the front towards the back, like looking down through a slice, so they see the horizontal plane. Together they surround the heart, which is why 12 leads can show which wall is affected.
| Wall of the heart | Leads that look at it |
|---|---|
| Septal | V1, V2 |
| Anterior | V3, V4 |
| Lateral | I, aVL, V5, V6 |
| Inferior | II, III, aVF |
Sticker tips
Use clean, dry skin and clip hair if the sticker will not stick. Avoid bony areas and thick muscle. On breast tissue place chest electrodes under the breast, not on it. Count the intercostal space from the sternal angle rather than guessing, because electrodes placed too high or too low change the shape of the trace. Ask the patient to lie still and relaxed, because movement and tension create interference. Colour codes differ between standards, so check the labels on your device. In children the electrodes are the same, but follow local policy for extra right-sided leads and paediatric pads.
Common Arrhythmias Compared
| Rhythm | Rate | Regularity | P waves | QRS |
|---|---|---|---|---|
| Sinus tachycardia | Fast | Regular | Present, normal | Narrow |
| Sinus bradycardia | Slow | Regular | Present, normal | Narrow |
| Atrial fibrillation | Variable, often fast | Irregularly irregular | Absent/chaotic | Narrow (usually) |
| SVT | Very fast (often >200 in children) | Regular | Often absent/hidden | Narrow |
| Ventricular tachycardia | Fast | Usually regular | Absent/dissociated | Wide |
| Ventricular fibrillation | Chaotic, unmeasurable | Chaotic | Absent | No organised complexes |
Exam tip
Heart block is graded by how much the AV node delay is disrupted: 1st degree just prolongs the PR interval; 2nd degree drops occasional beats; 3rd degree (complete) loses the connection entirely, so atria and ventricles beat independently of each other.
Normal vs Abnormal: See the Difference
Five rhythm strips drawn in the same style as the real trace above, with the line changed to show each problem. They are simulated teaching strips, not patient recordings, but each is the pattern you would learn to spot.
Why it's normal: every QRS is preceded by a P wave, the P–R gap is consistent, the QRS is narrow, and the beats are evenly spaced. This is the SA node driving the heart exactly as it should.
Why it's abnormal: no organised P waves — just a chaotic, wavy baseline from disorganised atrial activity — and the gap between QRS complexes keeps changing. This is the “irregularly irregular” pattern that defines AF.
Why it's abnormal: the rate is far too fast for the P waves to be seen at all, but the QRS stays narrow and regular — the signal is still using the normal conduction pathway, just firing much too quickly and starting/stopping suddenly.
Why it's abnormal: the complexes are wide and oddly shaped instead of the usual sharp, narrow spike — the signal is spreading through the ventricles abnormally rather than down the normal conduction pathway. Fast, wide, and regular like this needs urgent attention.
Why it's abnormal: the P waves (blue arrows) march along at their own steady, faster rate, completely independent of the QRS complexes, which run at their own steady, much slower rate. Some P waves land inside a QRS or T wave, and none is reliably followed by a QRS. The AV node connection has been lost entirely — atria and ventricles are no longer “talking” to each other at all.
Paediatric Resting Heart Rate by Age
| Age | Typical resting rate |
|---|---|
| Newborn | 100–160 bpm |
| 1–12 months | 100–150 bpm |
| 1–5 years | 90–140 bpm |
| 5–12 years | 70–120 bpm |
| Adolescent/adult | 60–100 bpm |
Quick Mnemonic Recap
The pathway
SA → AV → Bundle of His → bundle branches → Purkinje fibres
Backup rates
SA ~60–100 → junctional ~40–60 → ventricular ~20–40 bpm
Narrow vs wide
Narrow = normal pathway. Wide = abnormal ventricular conduction, treat with caution
Always ask
Is the patient actually perfusing this rhythm?
Quick self-test
Sources & References
Resuscitation Council UK (2021) — 2021 Resuscitation GuidelinesWaugh A & Grant A (2018) — Ross and Wilson Anatomy and Physiology in Health and Illness (13th edn)NICE (2021) — Atrial fibrillation: diagnosis and management (NG196)Park MK & Salamat MK (2020) — Park’s Pediatric Cardiology for Practitioners (7th edn)Also practise with
Keep the momentum
One useful next step beats opening twelve new tabs.
Practise next
Use this page, then move straight into practice.
You have already done the reading. The best next move is a short practice block or one related guide, while the details are still fresh.